

Geotab Introduces the New Safety Overview Page in MyGeotab
Managing fleet safety often requires reviewing several reports to understand driver behaviour, identify risk, and decide where coaching is needed. Geotab’s new Safety Overview page brings this information together in one centralized dashboard within MyGeotab.
The new page is designed to help fleet and safety managers evaluate performance, identify higher-risk drivers and vehicles, and take action without manually combining data from multiple reports.
A Centralized View of Fleet Safety
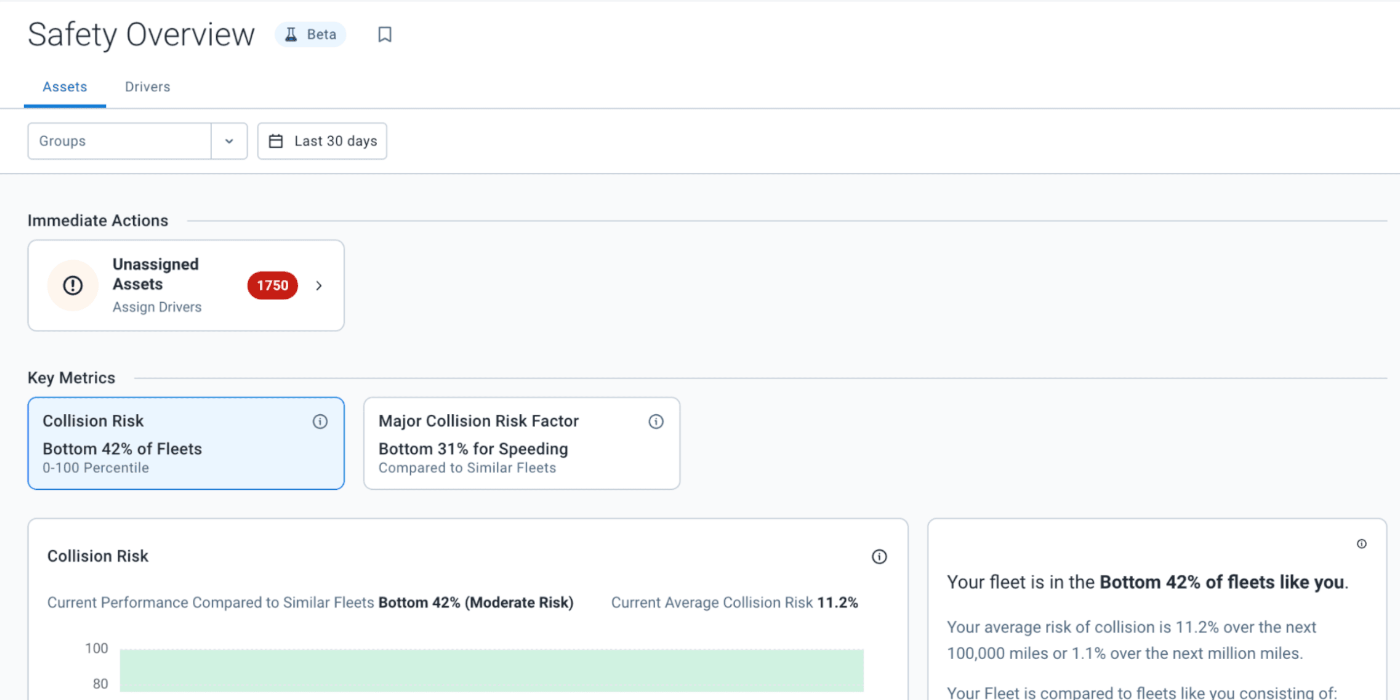
The Safety Overview page provides a high-level picture of safety performance across a fleet. Managers can switch between Drivers and Assets tabs, select specific groups, and adjust the date range to focus on the information most relevant to their operation.
Urgent action items appear near the top of the page, allowing managers to review important safety concerns and access the underlying data. Instead of searching through separate reports, users can begin with the areas that may require immediate attention.
Daily Fleet Safety Metric
One of the main features is a Safety Metric scored from 0 to 100. The score is updated daily and provides a quick indication of the fleet’s overall level of risk.
This makes it easier to monitor changes over time and determine whether safety initiatives are producing measurable improvements. Managers can use the score as a starting point before examining the behaviours or individuals contributing to the result.
Compare Performance Through Industry Benchmarking
A safety score is more useful when it has context. The Safety Overview page includes industry benchmarking that shows how a fleet compares with similar fleets.
Geotab evaluates performance against fleets completing similar work, operating comparable assets, and working in similar regions. A percentile ranking helps managers understand whether their results are above or below those of their peers and establish more realistic safety goals.
Identify High-Risk Drivers and Assets
The dashboard automatically ranks drivers and assets according to risk. Separate lists highlight high-risk performers and top performers, helping managers identify who may need coaching and recognize drivers demonstrating safer behaviour.
Selecting a driver or asset opens a more detailed view of their performance. Managers can then investigate relevant events and review the specific areas contributing to that person’s or vehicle’s ranking.
Review Specific Driving Behaviours
The Safety Overview page helps managers identify the behaviours affecting fleet risk. Available metrics may include:
- Speeding
- Harsh cornering
- Harsh braking
- Harsh acceleration
- Tailgating
- Collision risk
- Detected collisions
These measurements can help safety teams move beyond a general score and identify the behaviours that require attention. For example, a fleet may have an acceptable overall result while one group shows a recurring speeding or harsh-braking concern.
For fleets using compatible cameras, the page may also display video associated with high-risk events, providing additional context for investigation and driver coaching.
Monitor Safety Across Different Fleet Groups
Managers can filter the dashboard by group to compare departments, locations, vehicle types, or other parts of the organization. Permissions can also be configured so supervisors only see information for the teams they manage.
This allows larger organizations to maintain a consistent safety program while giving individual managers access to the data most relevant to their responsibilities.
Why the Safety Overview Page Matters
By centralizing safety scores, benchmarking, behaviour metrics, and ranked risk information, Geotab reduces the manual work involved in safety reporting. Managers can spend less time exporting and cross-referencing data and more time addressing the issues revealed by that data.
The result is a more focused approach to driver coaching, performance monitoring, and fleet safety planning.
How to Access the Safety Overview Page
Geotab states that no additional setup is required. Authorized users can sign in to MyGeotab and navigate to Safety > Overview. They can then select the desired drivers, assets, groups, and reporting period.
Geotab currently identifies the Safety Overview page as a global Beta release, so its design and available features may continue to evolve.
GPS Tracking Canada can help your business understand Geotab safety tools, configure MyGeotab, and turn fleet data into a practical driver coaching strategy. To learn more about the Safety Overview page or other Geotab fleet safety solutions, contact us today.
Frequently Asked Questions
What is the Geotab Safety Overview page?
The Geotab Safety Overview page is a centralized dashboard in MyGeotab that helps fleet managers review safety scores, driver behaviour, vehicle risk, and other important safety information.
Where can users find the Safety Overview page?
Authorized users can access the page by signing in to MyGeotab and navigating to Safety > Overview.
What is the Safety Metric?
The Safety Metric is a score from 0 to 100 that provides a general indication of fleet risk. It is updated daily so managers can monitor changes in safety performance over time.
Does the Safety Overview page compare fleets with similar businesses?
Yes. Industry benchmarking allows a fleet to compare its safety performance with similar fleets based on factors such as operating region, asset type, and type of work.
Can managers identify high-risk drivers using the dashboard?
Yes. The Safety Overview page ranks drivers based on risk, helping managers identify individuals who may benefit from additional coaching or investigation.
Can the Safety Overview page evaluate individual vehicles?
Yes. Managers can switch between the Drivers and Assets tabs to review safety performance for individual drivers or vehicles.
What driving behaviours can the Safety Overview page monitor?
Depending on the available fleet data, metrics may include speeding, harsh braking, harsh acceleration, harsh cornering, tailgating, collision risk, and detected collisions.
Does the Safety Overview page support video footage?
For fleets using compatible camera solutions, the page may display video connected to high-risk driving events, providing additional context for safety reviews and coaching.
Can safety data be filtered by group or date range?
Yes. Users can select specific groups and reporting periods to review safety performance for particular departments, locations, teams, or timeframes.
Is the Geotab Safety Overview page generally available?
Geotab currently identifies the Safety Overview page as a global Beta feature. Its design, functionality, and available metrics may continue to change as the feature develops.